Children’s job is to make sense of the world and to sort out the things they see and do. They are like little data analysts, categorizing and making judgements about their interactions with objects and people. Graphing is a way for children to intentionally collect data, see it, reflect on it, and then ultimately interpret and make sense of it. For young children, making graphs as concrete as possible is key. “Real graphs” where children can use their own shoes to make a graph of the kinds of closures (laces, velcro, slip-ons) help children to see the similarities and differences in something they can relate to.
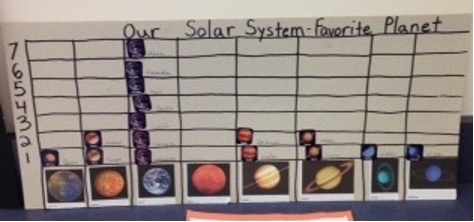
Eventually graphing can be done on paper – large, easy to read charts are best. Yes or no questions such as “I like dogs.” or and sorting questions such as “What color are your eyes?” help children to consider a range of answers. Reflect on data with a debrief – “What do you notice about this graph?” is a good starting question. Guide children to notice categories that have more, less, the same amount and then interpret what that might mean for the class as a group helps children to apply their observations to the real world. Have clipboards and small graphs available for children to make their own surveys and walk around the room asking, “What color do you like best?” This is an opportunity to teach tally marks or other ways of collecting data in a more abstract way.